

Real Time (for Supervisors)
Real Time is the main interface for call center supervisors. The supervisor can perform the following tasks:
- Monitor and manage calls, queues, service levels
- Set queue thresholds that flag potential issues with a queue—not enough agents, calls taking too long, too many calls
- Log agents into the VCC Admin Portal
- Change agents’ states
Monitor Users
Call center supervisors can monitor users. Double click the user you would like to monitor. You can see the following information about an agent that you have added to the Real Time desktop:
- The upper bar displays the agent’s current state and how long they have been in the state.
- The lower bar displays the length of time an agent has spent in each state for the day.
- The agent tooltip appears when you hover over an agent. The agent tooltip contains more detailed historical information about the agent’s states.
- The agent’s outline is colored according to how long the agent has been in their current state. Agents are outlined in gray.
- An inactive agent’s name on the Real Time desktop is prefixed with an exclamation mark.

Changing an Agents State
To change an agent’s state:
- Locate the agent within the Real Time desktop.
Note: If you cannot find the agent you are looking for, find them in the agent list located in the sidebar and double click their name. This adds them to the Real Time desktop.
- Right-click on the agent and the available states appear.
- Select the one you want to change it to.

Configuring Call Monitoring
Listening to an agent on a call gives a unique insight into how the agent deals with a client. A supervisor can listen to an inbound or outbound call in progress with the required permissions. The supervisor can listen to the call in three different modes:
- 3-Way – Similar to a conference call, the supervisor joins that call as a third-party. Using this method, the supervisor can speak and be heard by the customer and other agents. All three active parties are recorded using this method.
- Secret Monitor – In secret monitor mode, the supervisor cannot be heard on the call by either the agent or the customer. Only the agent and the customer are recorded if the call is recorded.
- Whisper Coaching – Using this method, the supervisor can listen to the agent and customer’s call and talk to the agent. The customer cannot hear the supervisor, but all active parties are recorded.
If your account has Supervisor Monitoring allowed and permission to use it, you must include the phone number you will be listening to for calls. To set your phone number for this feature, follow these steps:
- In the Call Monitoring section of the Real Time toolbar area, click Settings.
- Enter the number you will use in the Supervisor line number input field. The supervisor needs to enter their number in +1 format. Example +13035551234
- Click Save, when complete.

Monitoring a Call
If Supervisor Monitoring is enabled for your account, and if you have permission to use it:
- The call monitoring section appears in the Real Time toolbar
- You can listen to other agents’ calls
- Locate the agent within the Real Time desktop.
- The agent must be in one of the following states:
- Busy In
- Busy Out
- Transfer (if using CCXML)
- Right-click the agent.
- Select one how you would like to monitor:
- Secret Monitor
- 3-Way
- Whisper Coaching
- When the option is selected, your phone will ring, once you answer, you will be able to hear and interact, when necessary.
- Alerts will appear in the Alerts window signaling the start and end of your monitoring process.
- The name of the agent you are supervising and the time you have been listening to the call appears in the call monitoring section.
- The icon alongside the name of the agent you are supervising changes to a speaker.
- On the right side of the sidebar click the Groups tab.
- Then double-click the group to place it on the desktop.
- In the group window that appears in the desktop, you can see the following information:
- The group’s left side displays the names of the agents in the group, a colored icon that represents the agents’ states, and the number of groups that an agent is assigned to.
- The group’s right side displays the names of the major states and the number of agents in the group in those states. When you click a major state, the list of agents on the left side displays only the agents in that state.
- To display an agent’s minor state in the lower-right corner of the group along with how long they have been in that state, click the agent’s name.
- To change an agent’s state, right-click the agent’s name. A menu of available states appears. Click the state you want the agent to be in.
- To add the agent to the RealTime desktop, double-click the agent’s name.
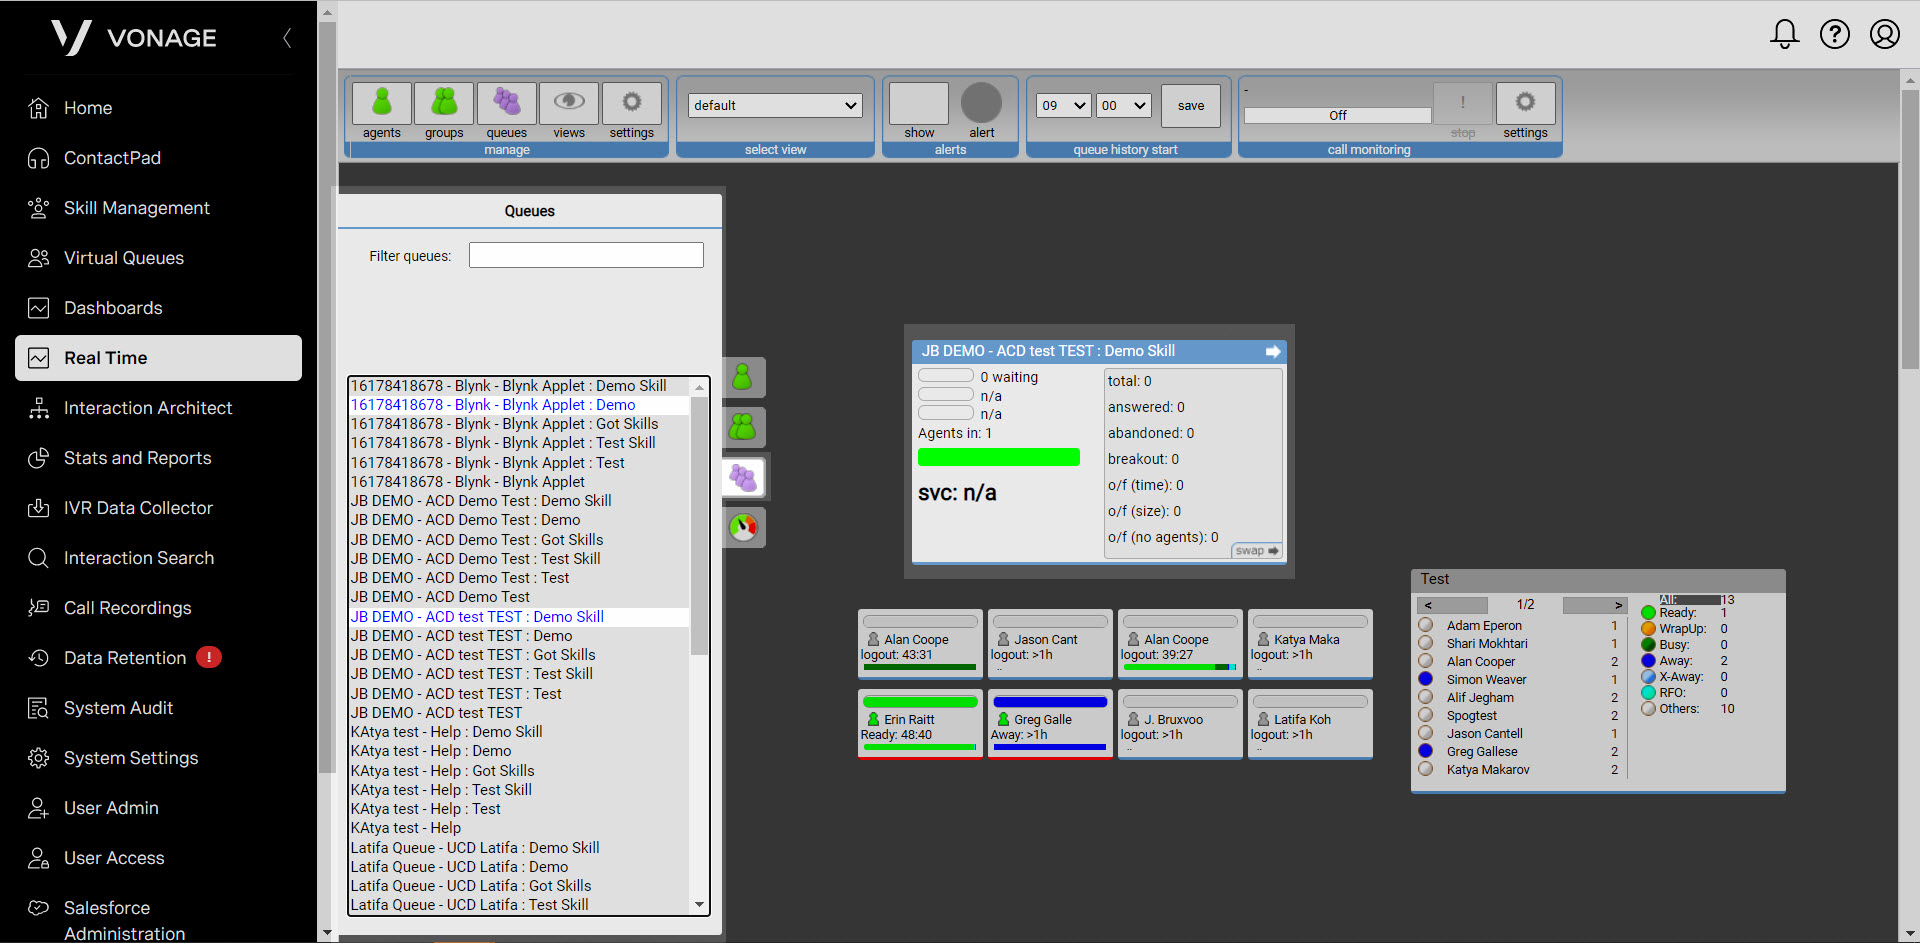
- On the right side of the sidebar click the Queues tab.
- Double-click the queue name to place it on the desktop.
- In the queue window that appears in the desktop, you can see the following information:
- The left side displays the following information about the current status of the queue:
- The number of calls in the queue.If the queue contains one or more calls, the following information appears:
- The average time, in seconds, that the call or calls have been in the queue.
- The time that the longest waiting call has been in the queue.
- The number of logged-in agents who are assigned to this queue.
- The distribution of states that the assigned agents are in.
- The current service level. A service level is the actual percentage of interactions that were answered within the target answer time.
- The right side displays three different views of historical data. The default view displays the total number of calls, and then a breakdown of the calls, as follows:
- Calls answered by an agent in the queue.
- Calls abandoned by the caller before being answered.
- Calls ended by the caller pressing a breakout key.
- Calls that overflowed to another queue because:
- The call spent too much time in the queue.
- The queue was full.
- No agents were serving the queue.
- Scroll through the Select list until you find the agent.
- Type part of the agent name in the Filter box. As you type, the list of agents in the Select list is filtered accordingly.
- Click New.
- Then enter the following information:
- Name
- ID
- Max WrapUp(s) – The max time, in seconds, that an agent in the group can be in the Wrap Up (Auto) state.
- Busy Thresholds – The max time, in second, an agent can be in a busy state.
- WrapUp Thresholds – The threshold time is that an agent can be in the Wrap-Up state in seconds.
- Max Unexpected(s) – The max time an agent can be in any of the Unexpected or Fault states, such as No Answer, or Line Busy in seconds.
- Add agents to this group. To add agents, you can use the Search available agents field to search the agents by name, or use the list of agents provided.
- Click on one or more agents and click the Right arrow button to move them to the Agents in group column.
- Click Save.
- Scroll through the Select list until you find the queue.
- Type part of the queue name in the Filter box. As you type, the list of queues in the Select list are filtered accordingly.
To supervise a call, follow these steps:
Note: If you cannot find the agent you are looking for, find them in the agent list located in the sidebar and double click their name. This should add them to the Real Time desktop.
When monitoring a call, the following things occur:
When you are finished monitoring the call, click the Stop button. You are disconnected from the call. However, the call remains active between the caller and agent.
Monitoring a Group
A group is a collection of agents. For example, you might group agents together by skill. You can monitor a group by placing the group to the RealTime desktop. To do this, follow these steps:


You can perform the following tasks:
Monitoring Queues
You can monitor a queue in Real Time once you have added it to the desktop. To do this, follow these steps:

Accessing Agent Options
To configure an agent within the Real Time dashboard, click the Agents tab in the top toolbar. The Manage Agents page appears. Find the agent that you want to edit.
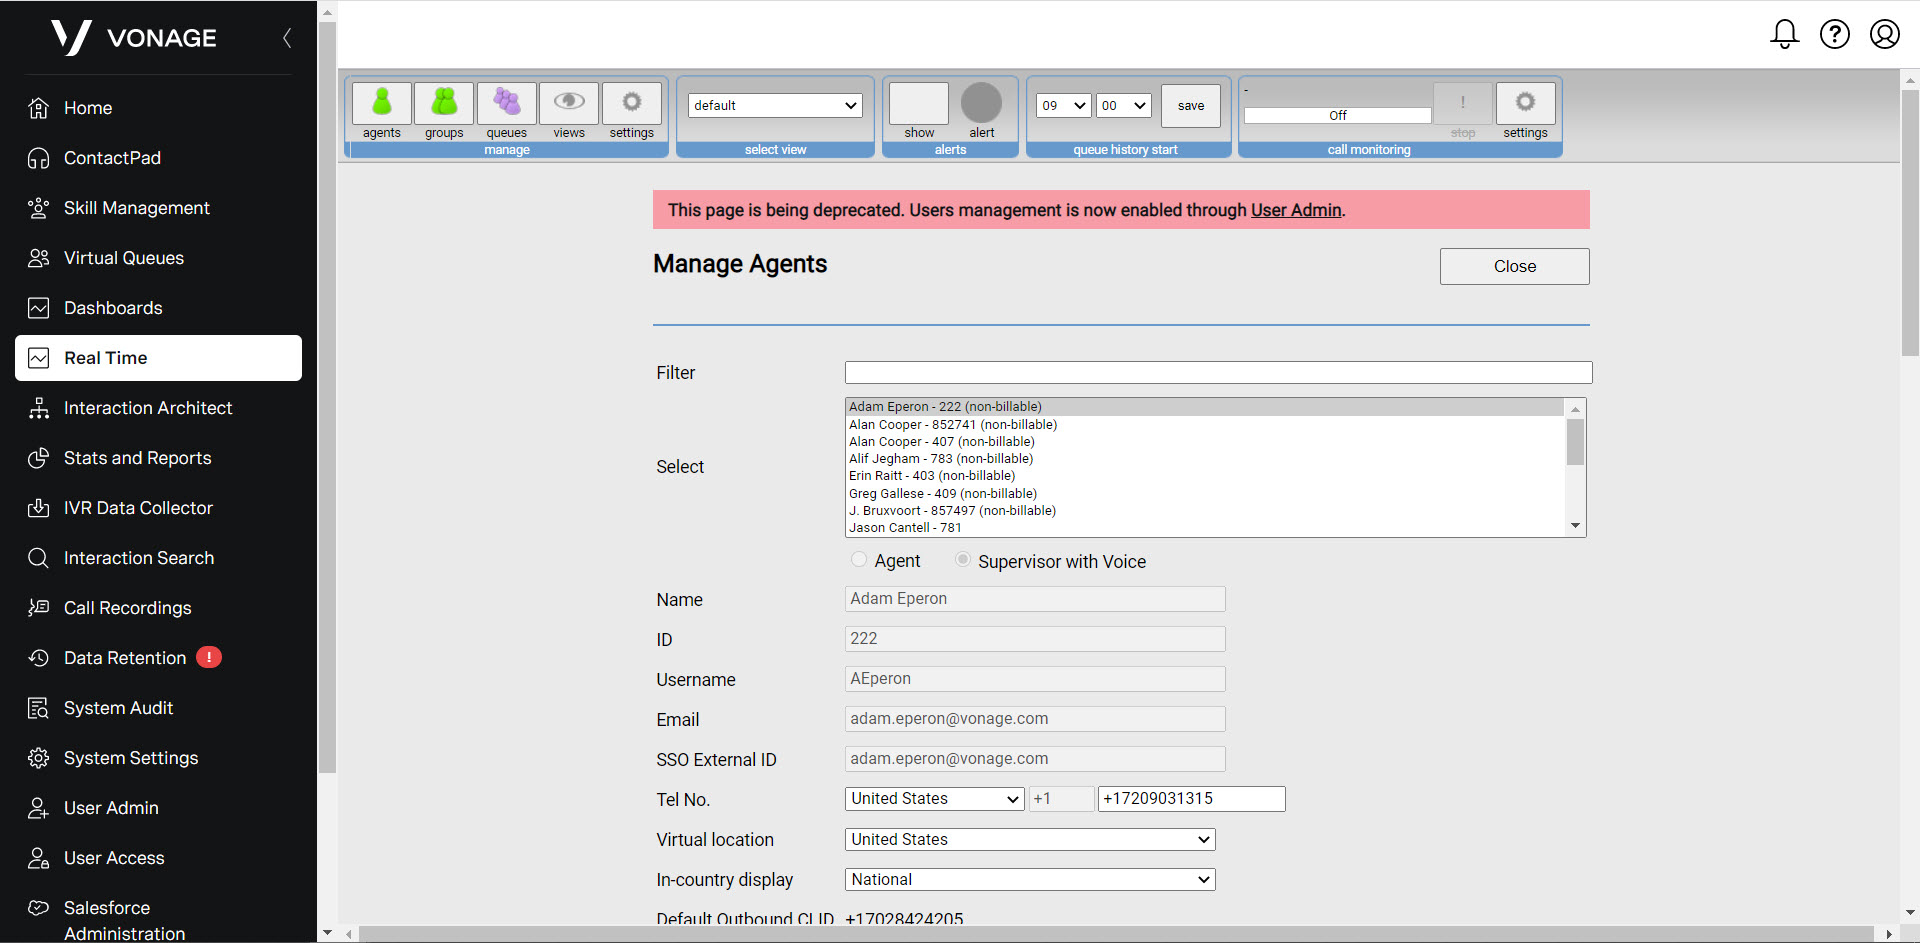
You can find agents in the following ways:
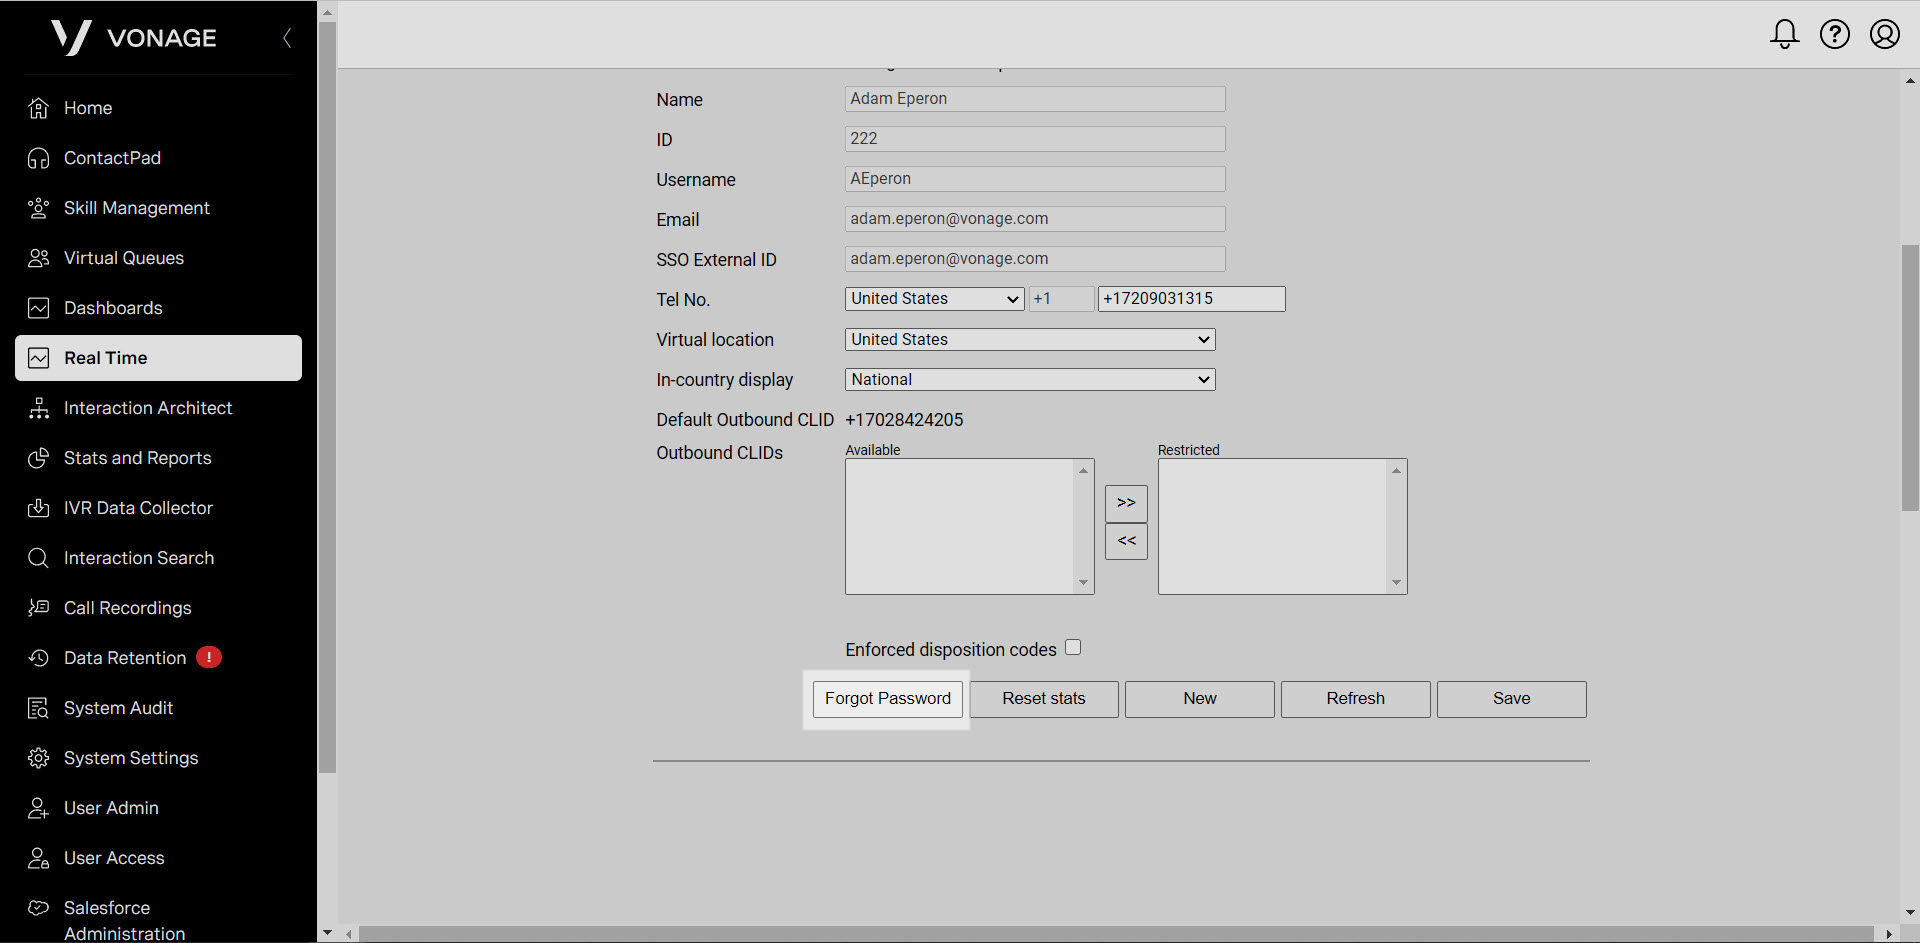
When you locate the agent you want, click the agent name. The fields in the lower section of the dialog box are populated with the agent’s details. Change any of the details in the editable fields, and click Save, when complete.
You can also change your password, by clicking the Forgot Password link.
Accessing Group Options
To configure a group within the Real Time dashboard, click the Group tab in the top toolbar area. The Manage Group page appears.
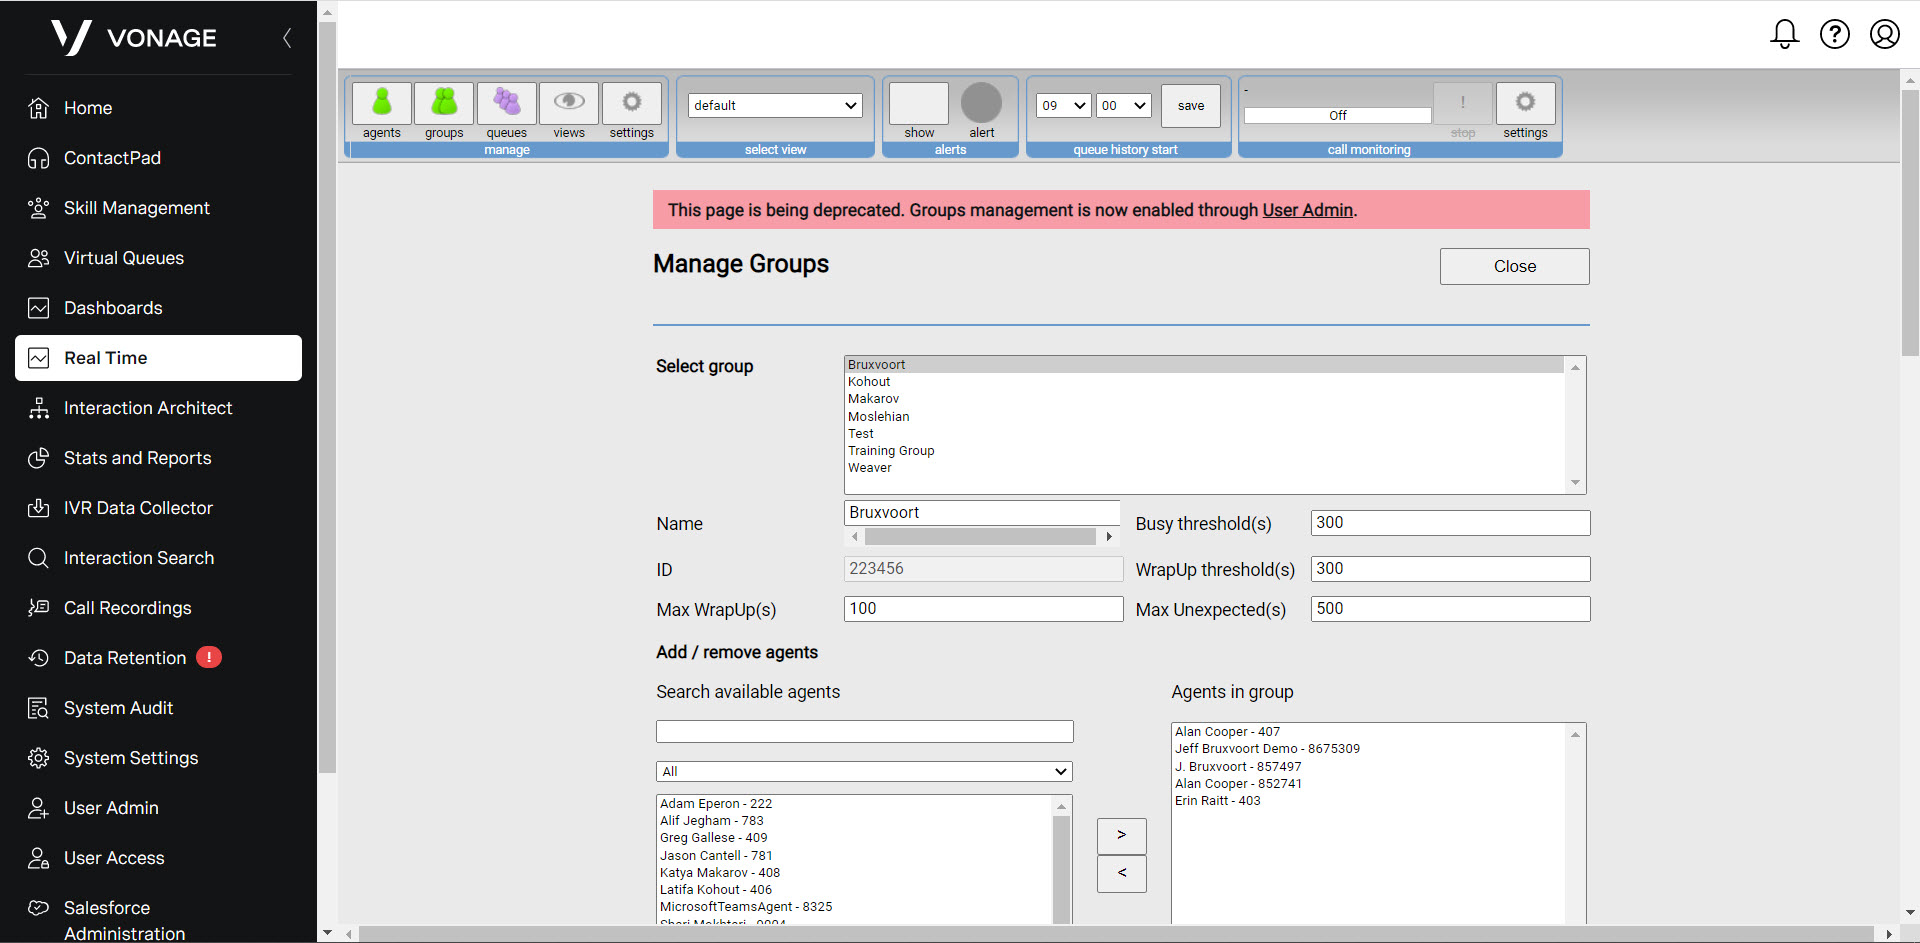
Find the group that you want to edit. When you locate the group you want, click the group name. The fields in the lower section of the dialog box are populated with the group’s details. Change any of the details in the editable fields, and click Save, when complete.
To create a group, follow these steps:

Accessing and Editing Queue Thresholds
To configure a queue threshold within the Real Time dashboard, click the Queues tab in the top toolbar. The Manage Queues page appears.

Find the queue that you want to edit. You can find queues in the following ways:
When you locate the queue you want, click the queue name. The fields in the lower section of the dialog box are populated with the queue threshold details.
Provide values for the queue thresholds, these threshold values determine the color used to highlight data. Satisfactory values are colored green. Data that exceeds, or does not achieve the threshold, are colored amber (caution) or red (warning) according to the color of the threshold column.
Once finished, click Save.
Setting Global Thresholds
To configure global thresholds within the Real Time dashboard, click the Settings tab in the top toolbar. The Settings page appears.
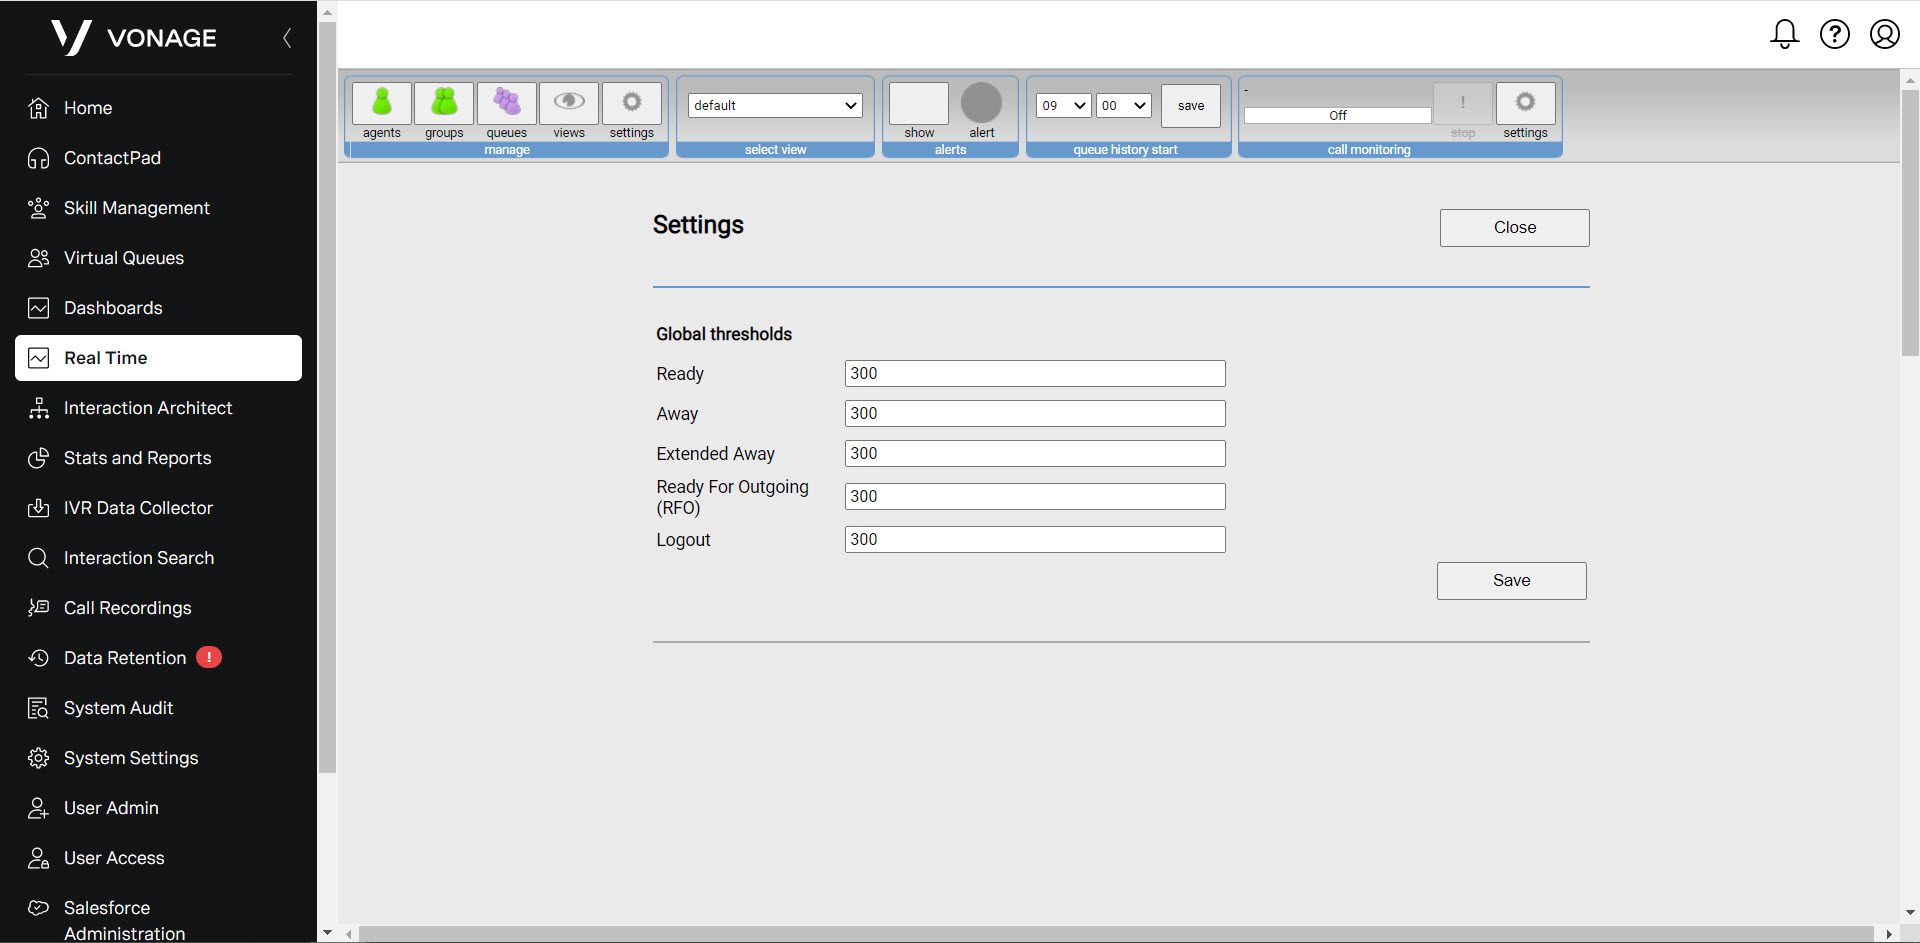
In the fields, each of the agent states, type the threshold for that state in seconds. Click Save. The alert icon flashes and the list of alerts are updated.