
Real-time Analytics
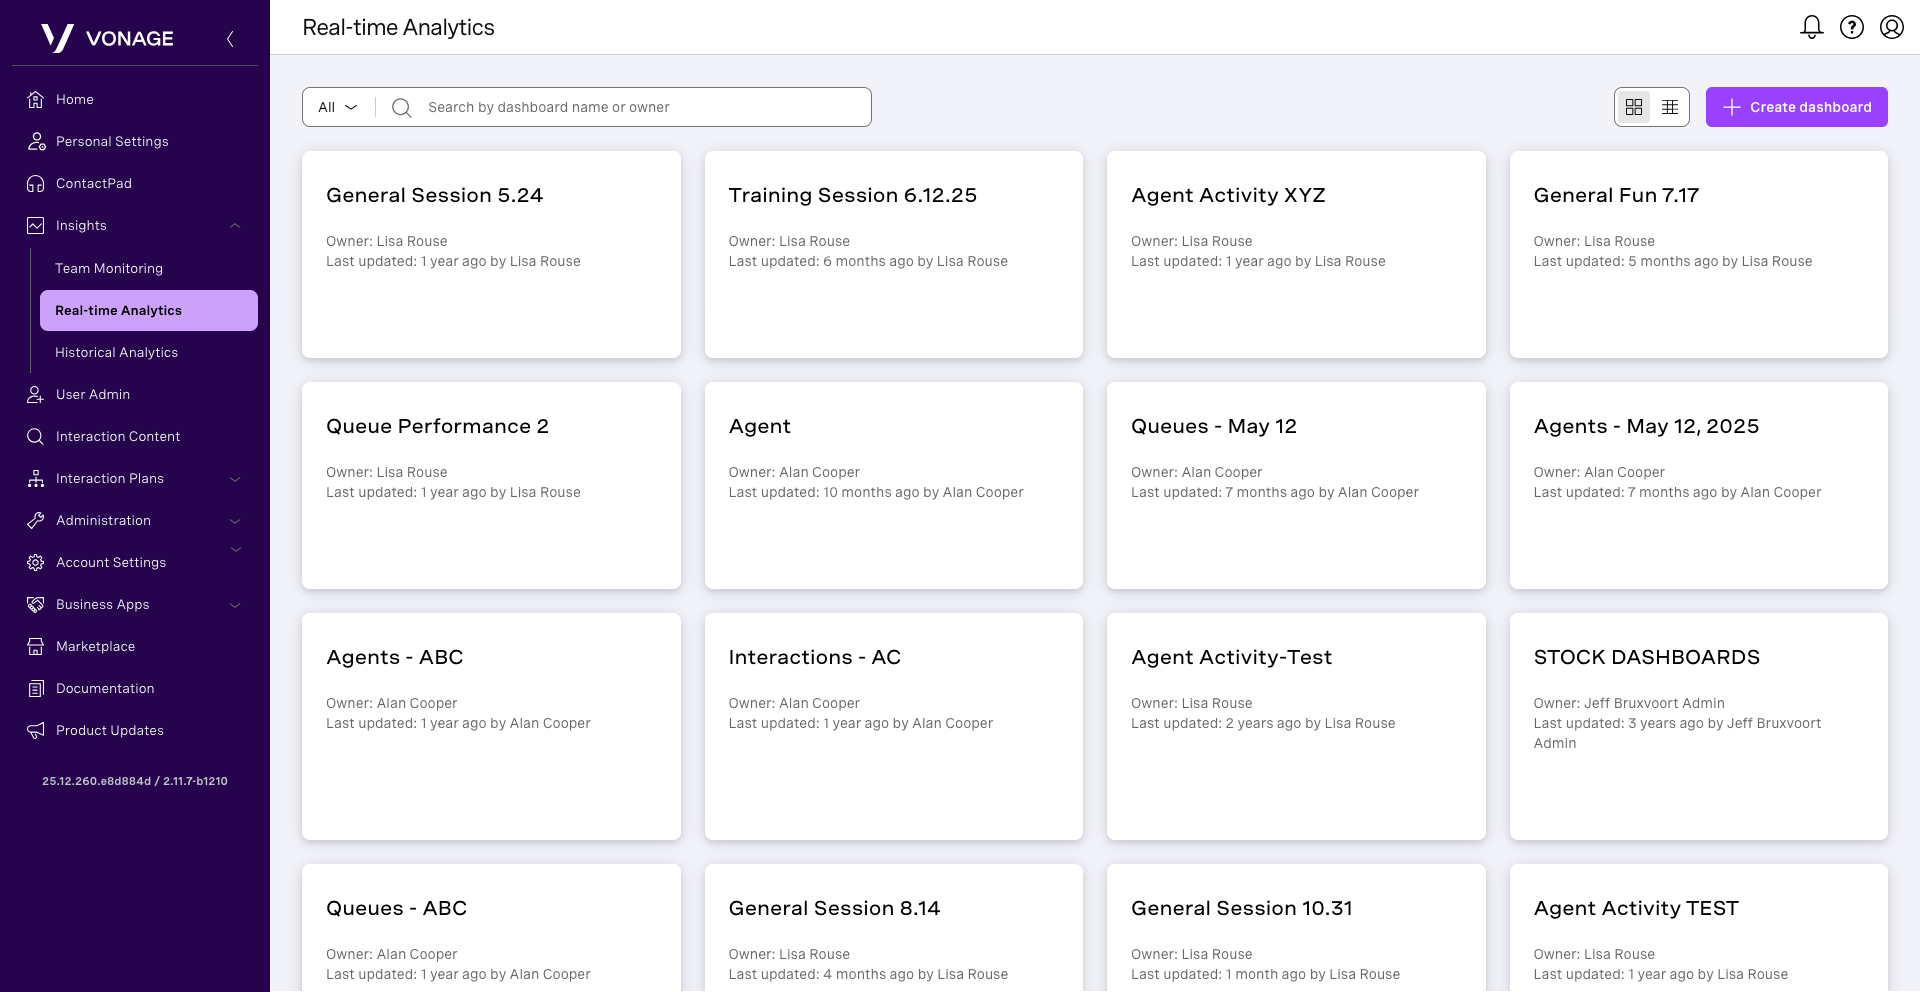
The VCC Admin Portal Real-time Analytics page contains dashboards that include interactive widgets that provide visibility into a Vonage Contact Center account’s activities. These interactive widgets are generated with data that can help you improve your customer service and sales experience. To access these dashboards, click Insights from the left-hand navigation and then select Real-time Analytics.
As mentioned above, the dashboard contains widgets, which are current snapshots of configured data about agents, interactions, and queues. A widget can contain one type of data at any time.
- Agent: These focused widgets can display interactions agents have handled, the time agents spent in each presence state, or handling those interactions or a combination of these.
- Interaction Details: These focused digits are from the customer’s point of view, including information about the customer’s telephone number, the number that called to reach VCC, and the time it took an agent to answer.
- Queues: These focused widgets contain queue-related data based on interactions within this queue.
Create a dashboard
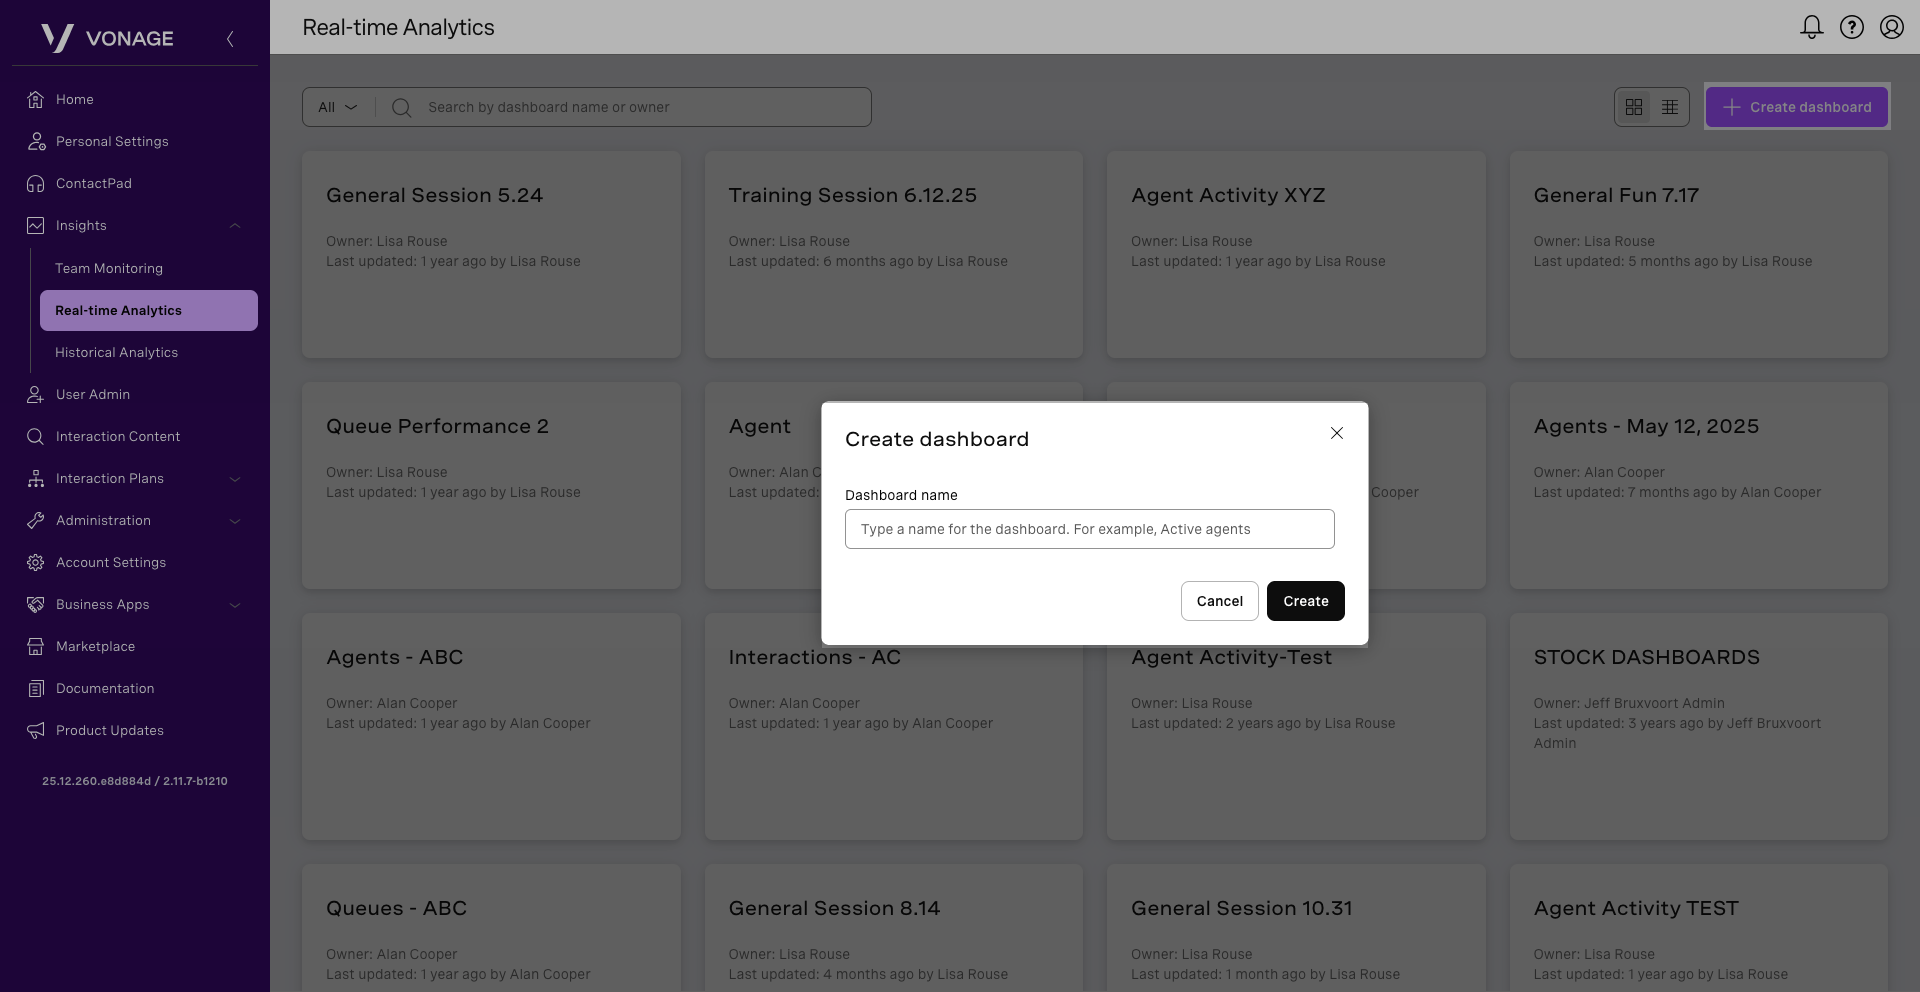
To create a new dashboard, from the Real-time Analytics page, click Create dashboard. In the dialog that appears, type a name for the name dashboard and click Create.
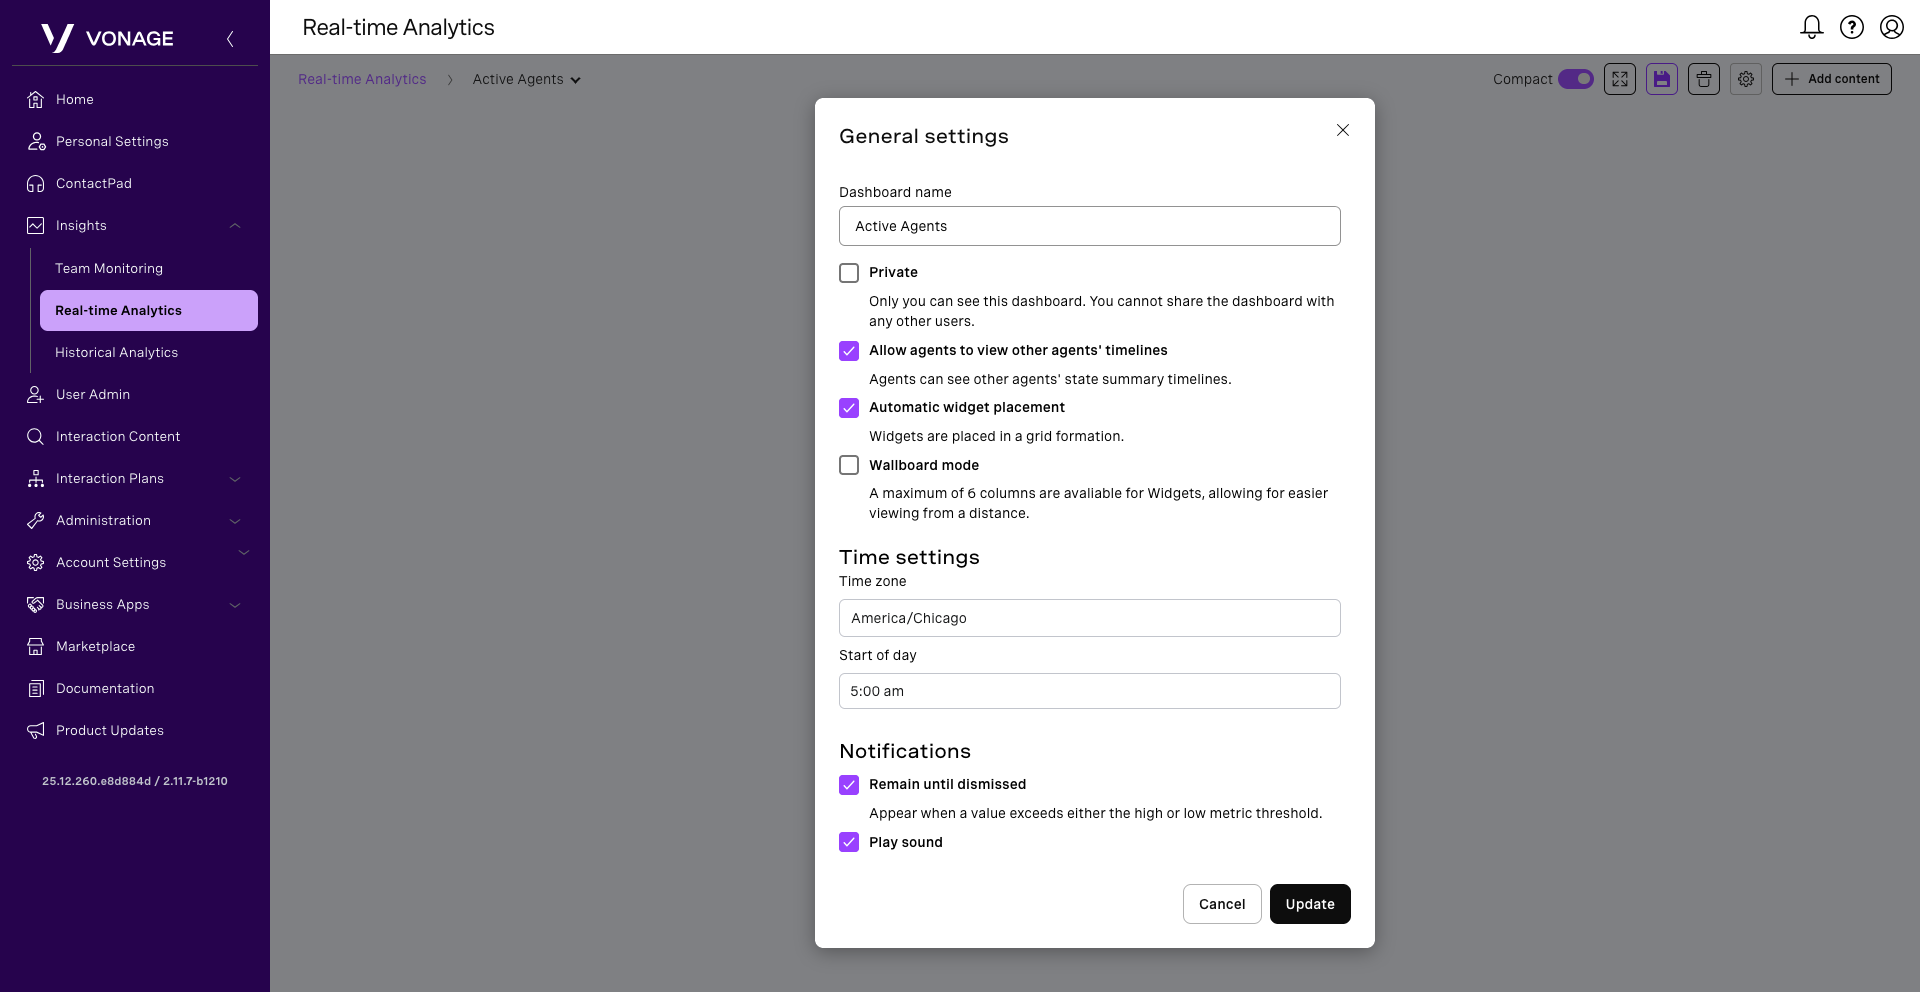
A new dashboard appears. To configure the settings, click the Settings icon. The General settings dialog box appears.
The following settings can be configured:
- Private: Select Private to make the dashboard unavailable to other users. By default, a private dashboard can only be seen by the person who created it. It cannot be shared with any other users.
- Allow agents to view other agents’ timelines: Select to give users of this dashboard access to the timelines of other agents.
- Automatic widget placement: Select to place widgets in a grid formation. Clear Automatic widget placement to be able to place widgets anywhere on the dashboard.
- Time zone: Select the time zone you want your dashboards to use when displaying data.
- Start of Day: This determines the time at which the data in the dashboard is displayed. For example, if you set the start day to 8 am, the dashboard will show data from 8 am up to 24 hours or 7:59 am the next day.
Notifications
- Remain until dismissed: Select to make browser notifications visible until you close them.
- Play sound: Select to play a sound along with the notifications.
Click Update.
To delete a dashboard, click on the Delete icon. You are prompted to confirm that you want to delete the dashboard. Click Delete.
Add a Widget
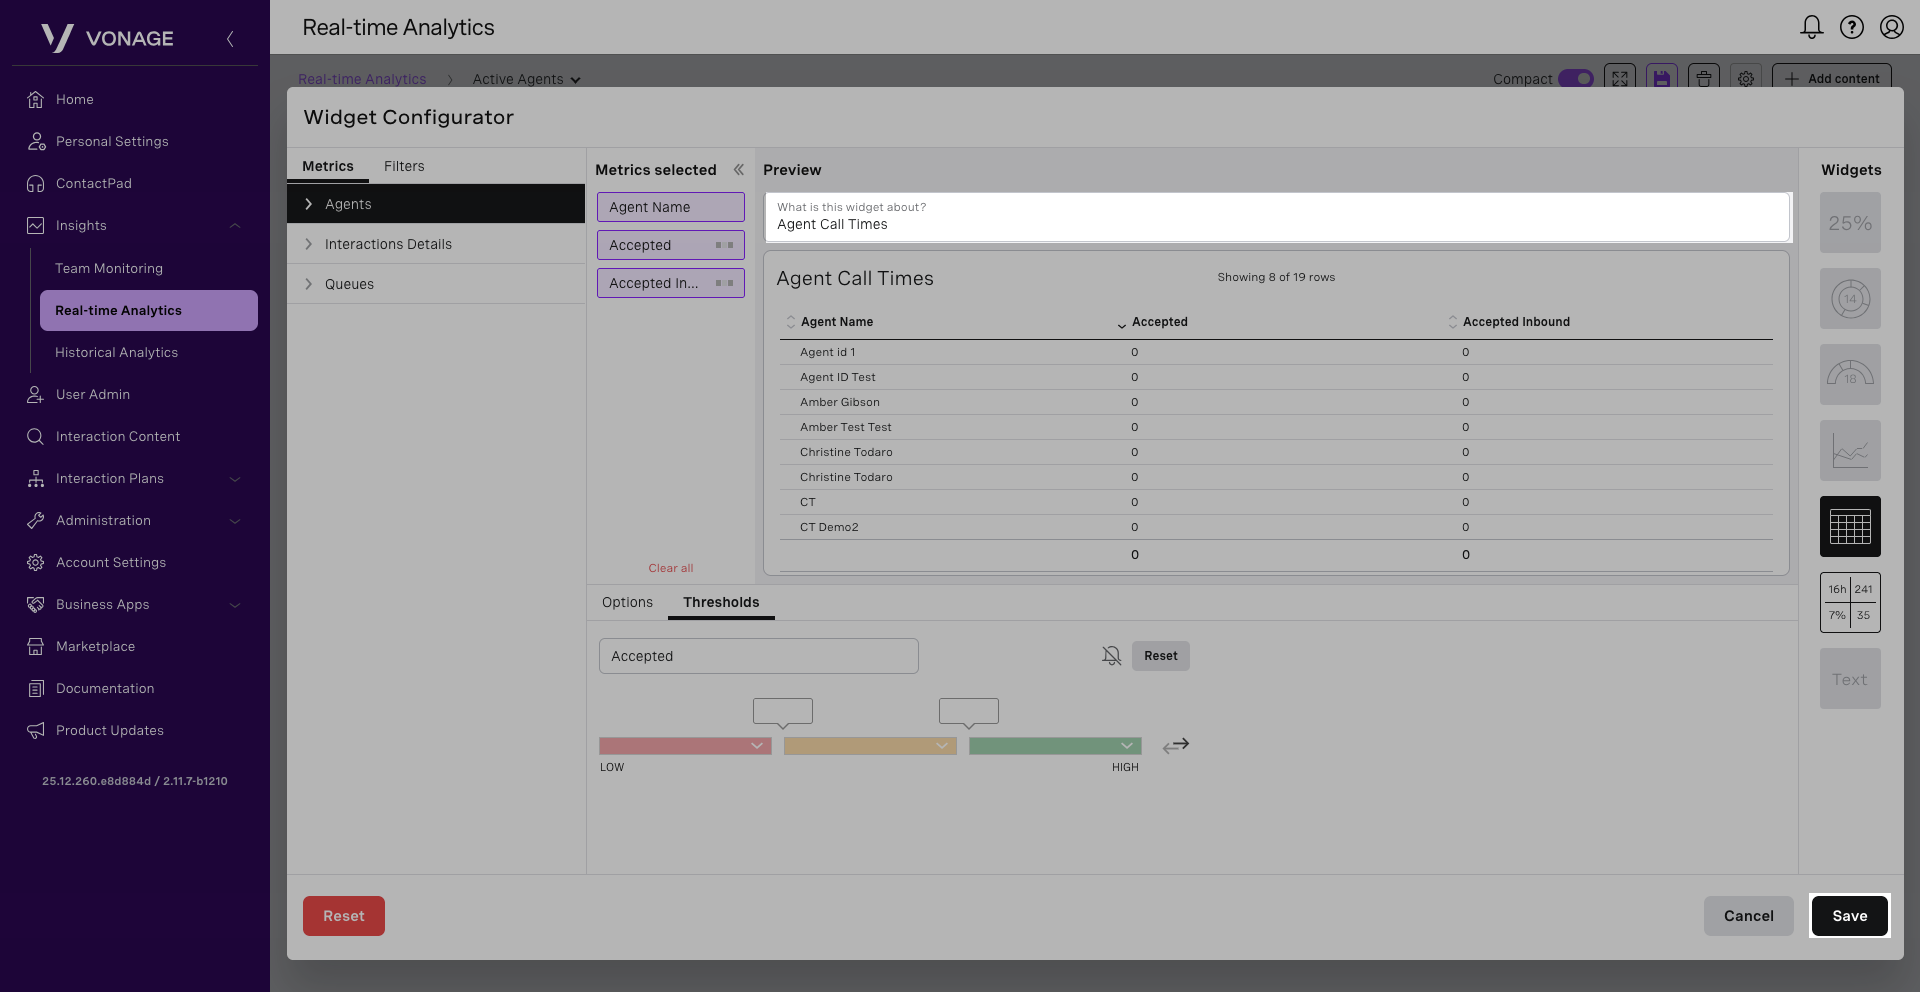
To add a widget to a Dashboard, select the dashboard you wish to edit. Then click on Add content. The Widget Configurator box appears.
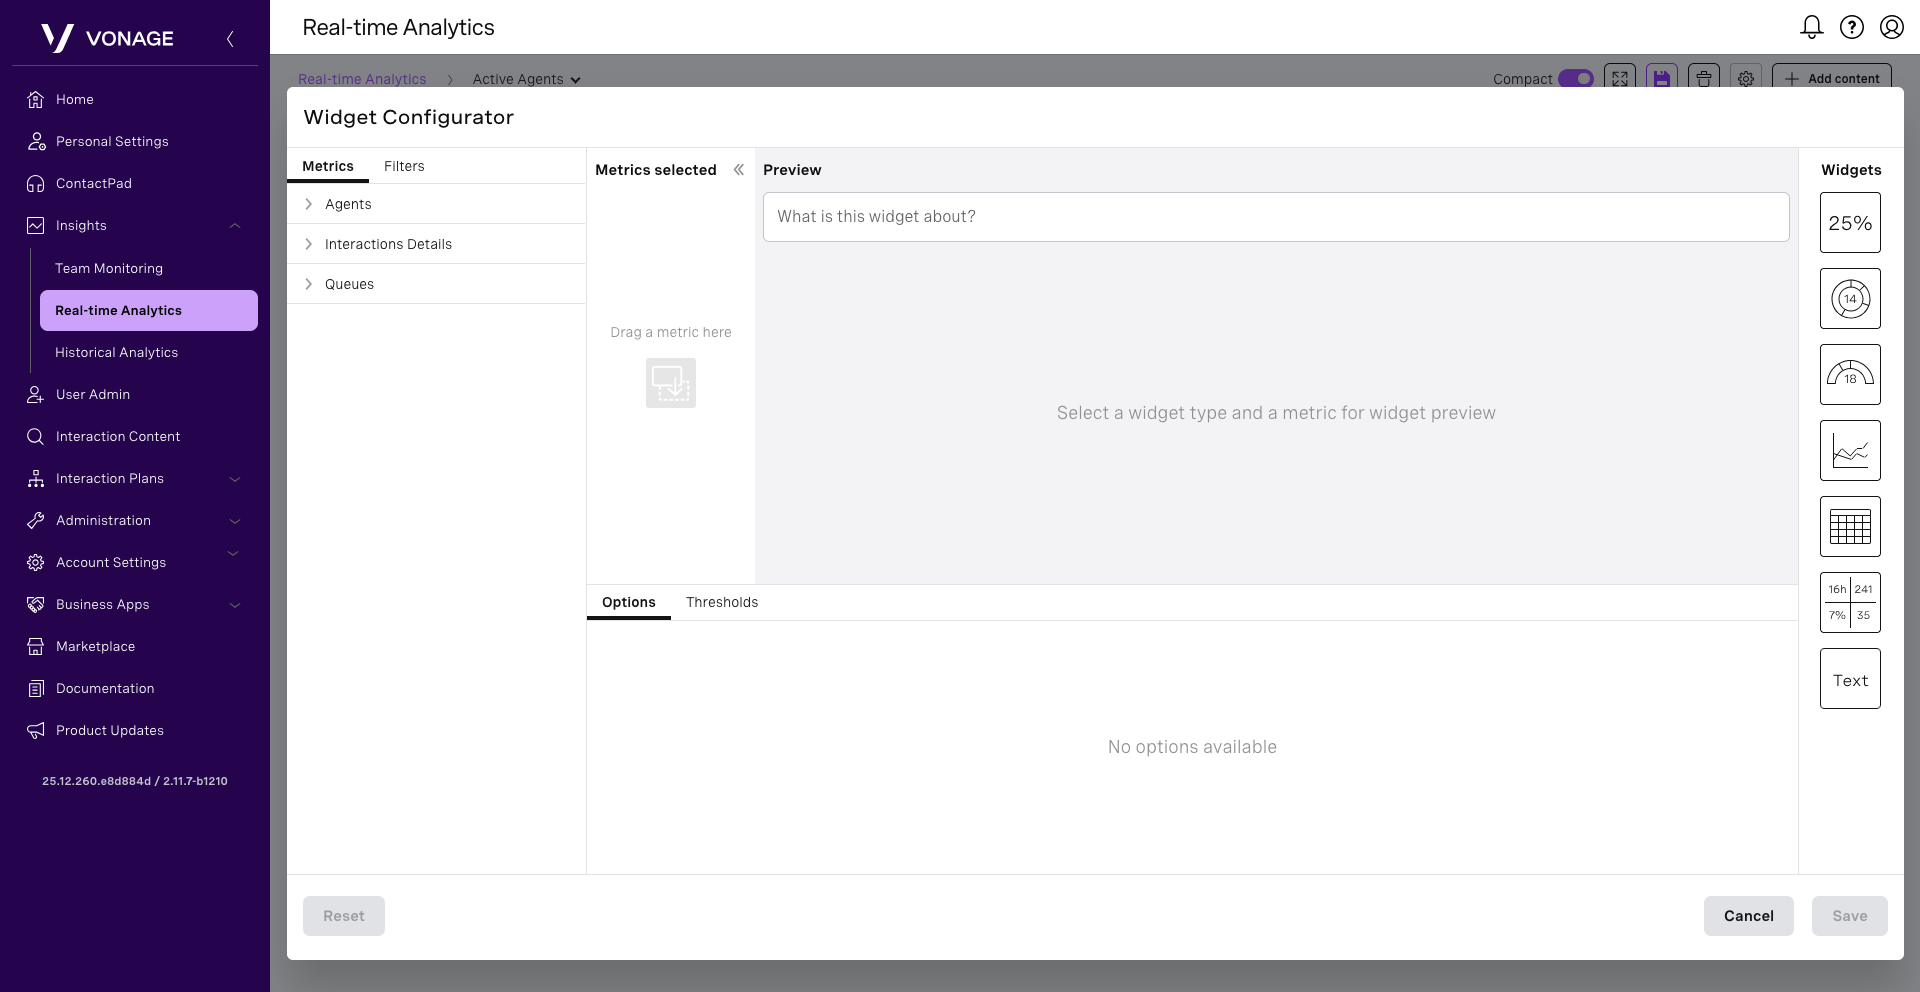
Start by selecting the metrics you wish to use for this widget. Select the type of data and metrics you want to view in your new widget. For this example, let’s focus on Agent.
Once expanded, select the group by metric. For this example, let’s use Agent. Select the metrics you wish to monitor from the list. Once selected, they will be displayed in the Metrics selected location. Here, you can move these metrics in the order you wish to see them within the widget. You will see a preview of the widget to the right of this area.
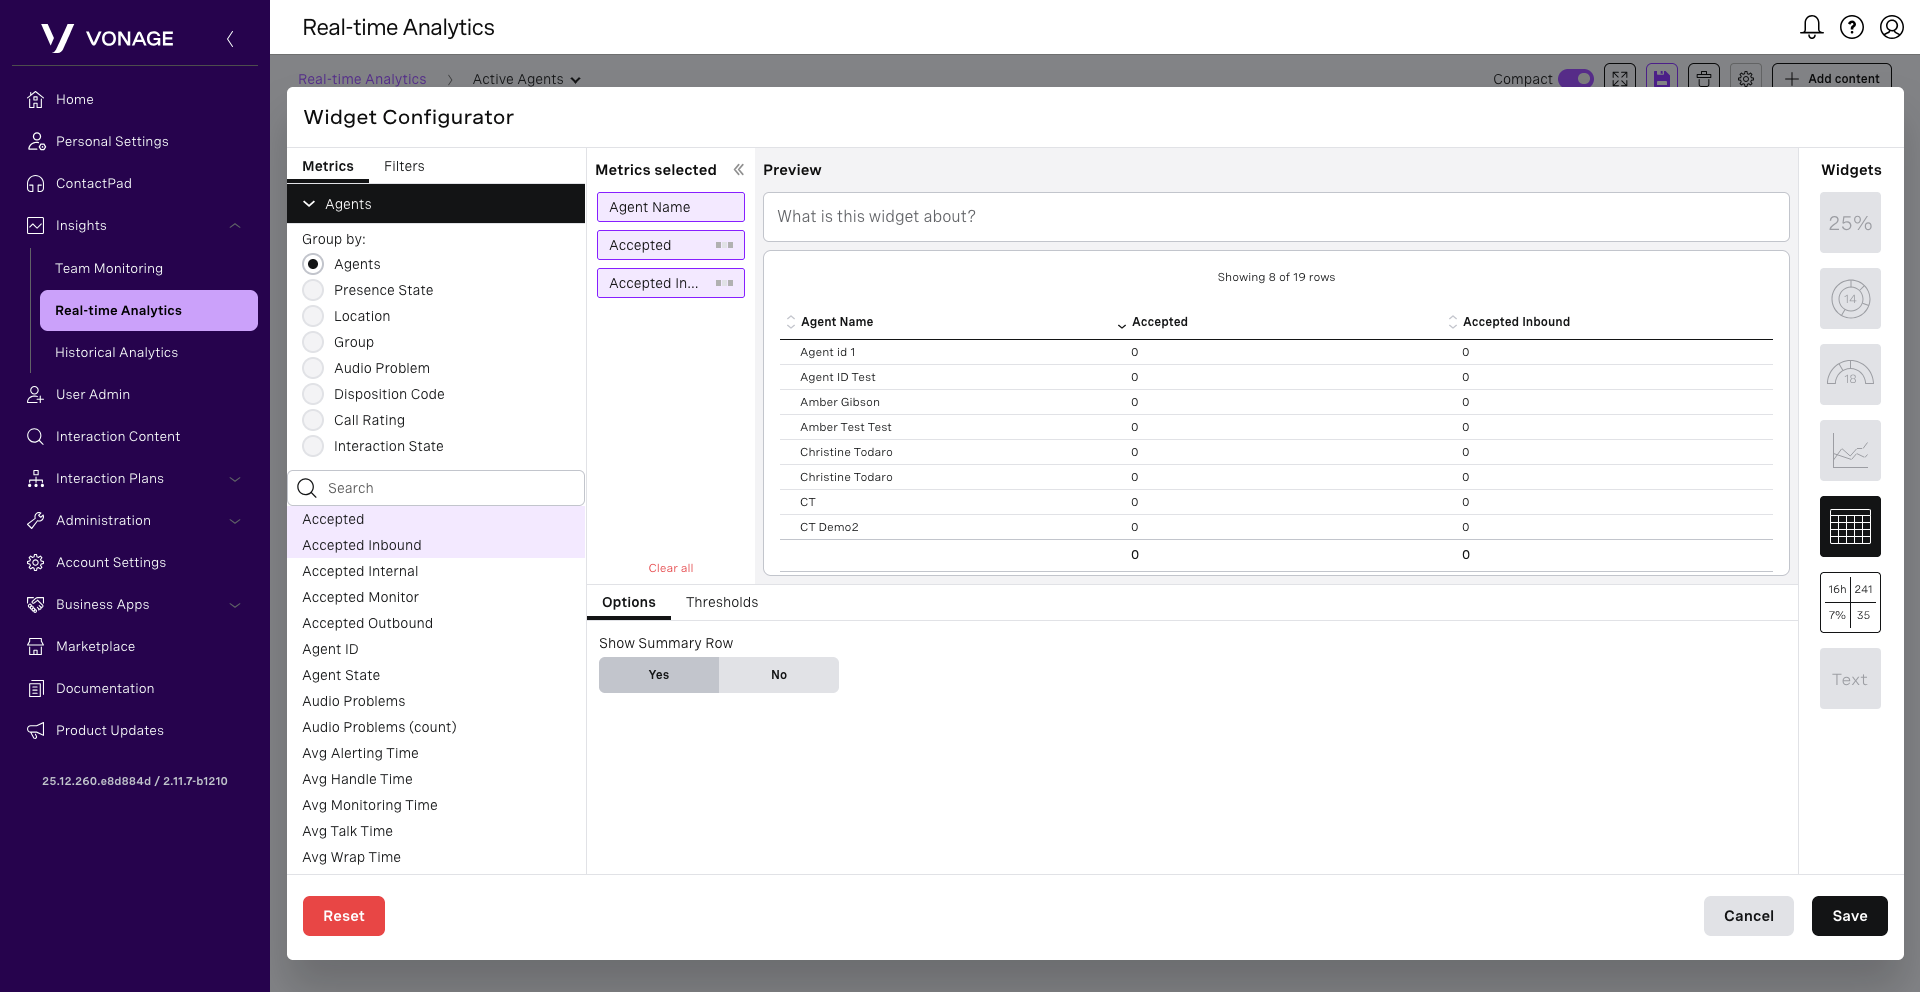
To remove a metric, hover over it and click the X. The metric will be deleted.
When you’ve picked all the metrics that you want to appear in your widget, click the Filters tab. You will have different filters available, depending on the metrics you have implemented. Configure your filtering option from the items below if applicable to your selected metrics:
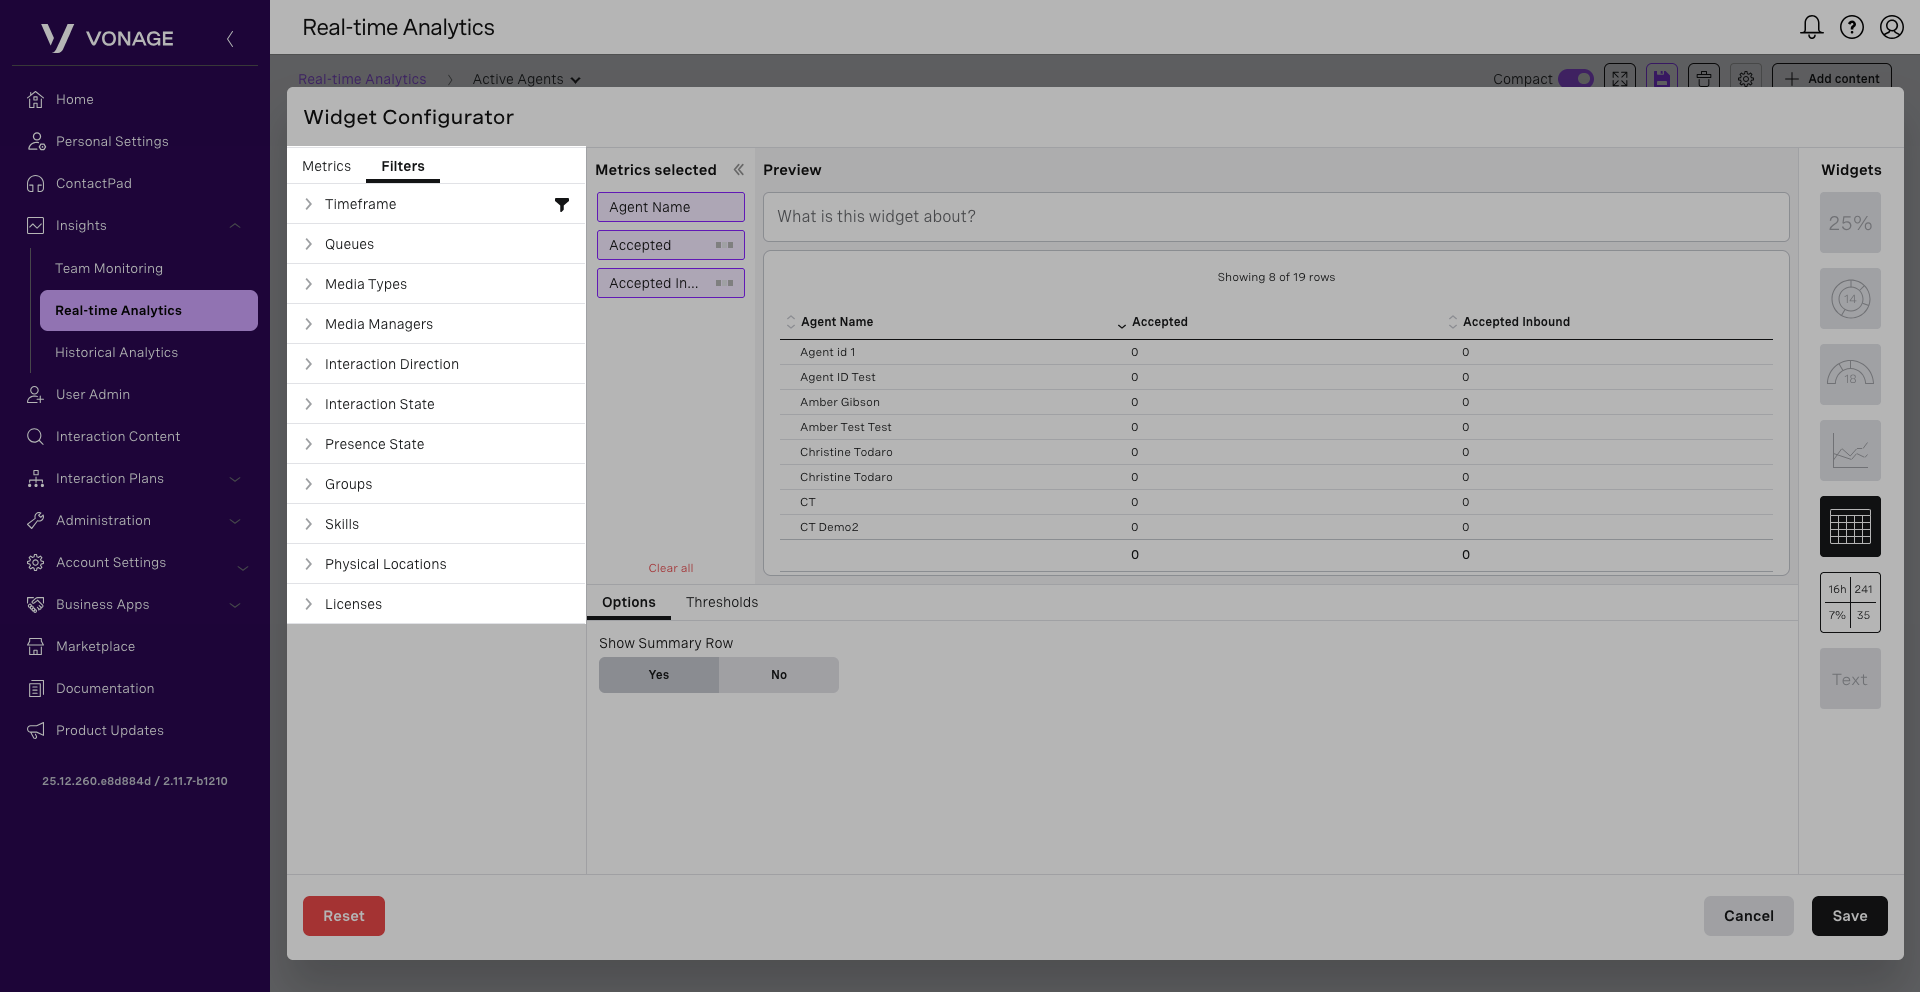
- Timeframe: Select the timeframe for the data to display. For example, if you select 30 minutes, the data shown will be from the previous 30 minutes.
- Queues: Select the queue or queues you want to display data for. For example, you may want to display metrics from the Sales queue team only.
- Media Types: Select the media type or media types you want to display data for.
- Interaction Direction: Select the direction of interaction you want to display data for. Please note/ by default all directions, inbound, outbound, and internal are selected.
- Interaction States: Select the interaction state you want to display data for. For example, if you only wanted to see ongoing interactions, make sure this is the only filter selected.
- Presence State: Select the agent presences that you want to display data for.
- Groups: Select the group or groups you want to display data for.
- Skills: Select the skill or skills you want to display data for.
- Physical Locations: Select the location or locations of the agents you want to display data for.
- Licenses: Select the license or licenses of the agents you want to display data for.
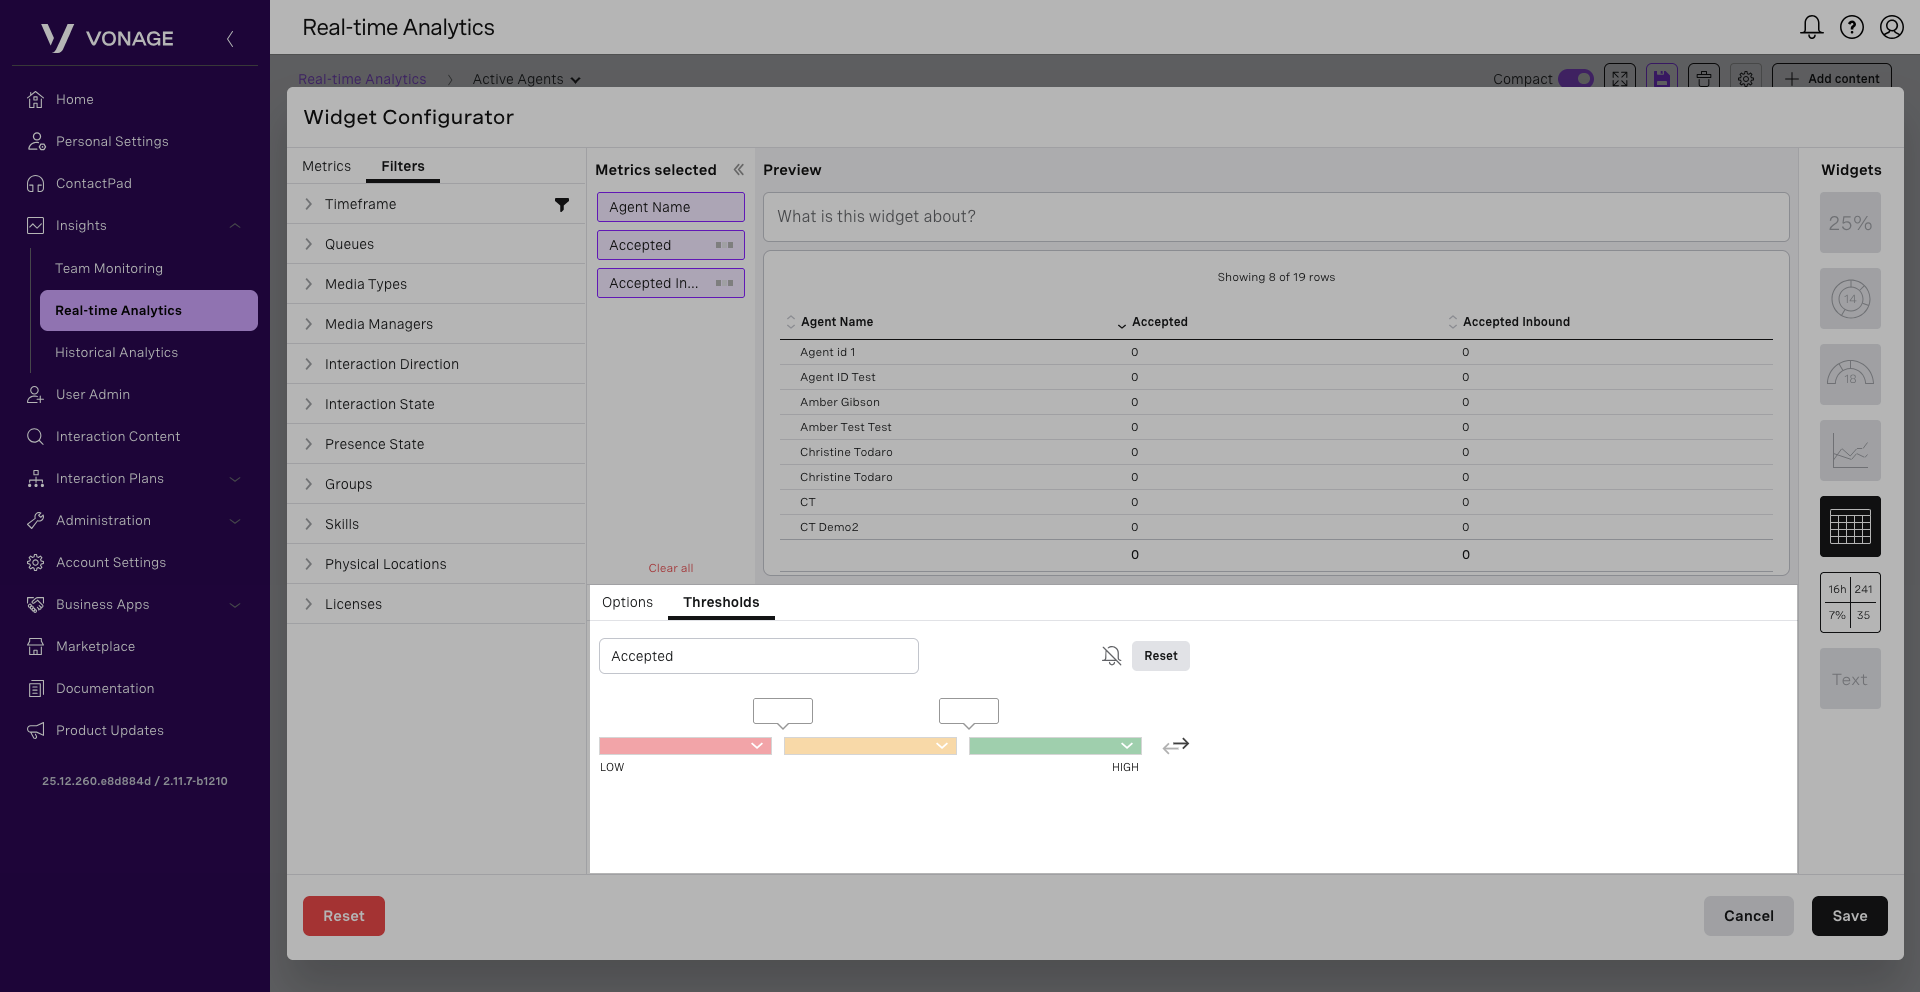
Defining thresholds
You may be able to customize threshold values depending on the metrics you pick. If you choose several metrics for which a threshold can be defined, a list of available metrics will appear. Click on the metric for which you want to set a threshold.
For time metrics, you must specify time thresholds; for number metrics, you must specify number thresholds; for percentage or fraction metrics, you must specify percentage thresholds.
The value in the field or fields on the left must be lower than the value in the field or fields on the right. Use the arrows on the right to switch the colors if you want the highest level of alert for a low or high value, accordingly. When you define a threshold for a metric, an indicator appears on the selected metric in the Metrics selected area.
Note: Once a threshold has been set, click the bell icon to activate a browser notification.
Once you have determined the metric and filters for your widget, proceed to provide a name for your widget in the What is this widget about? field. When you are satisfied with your settings, click Save.
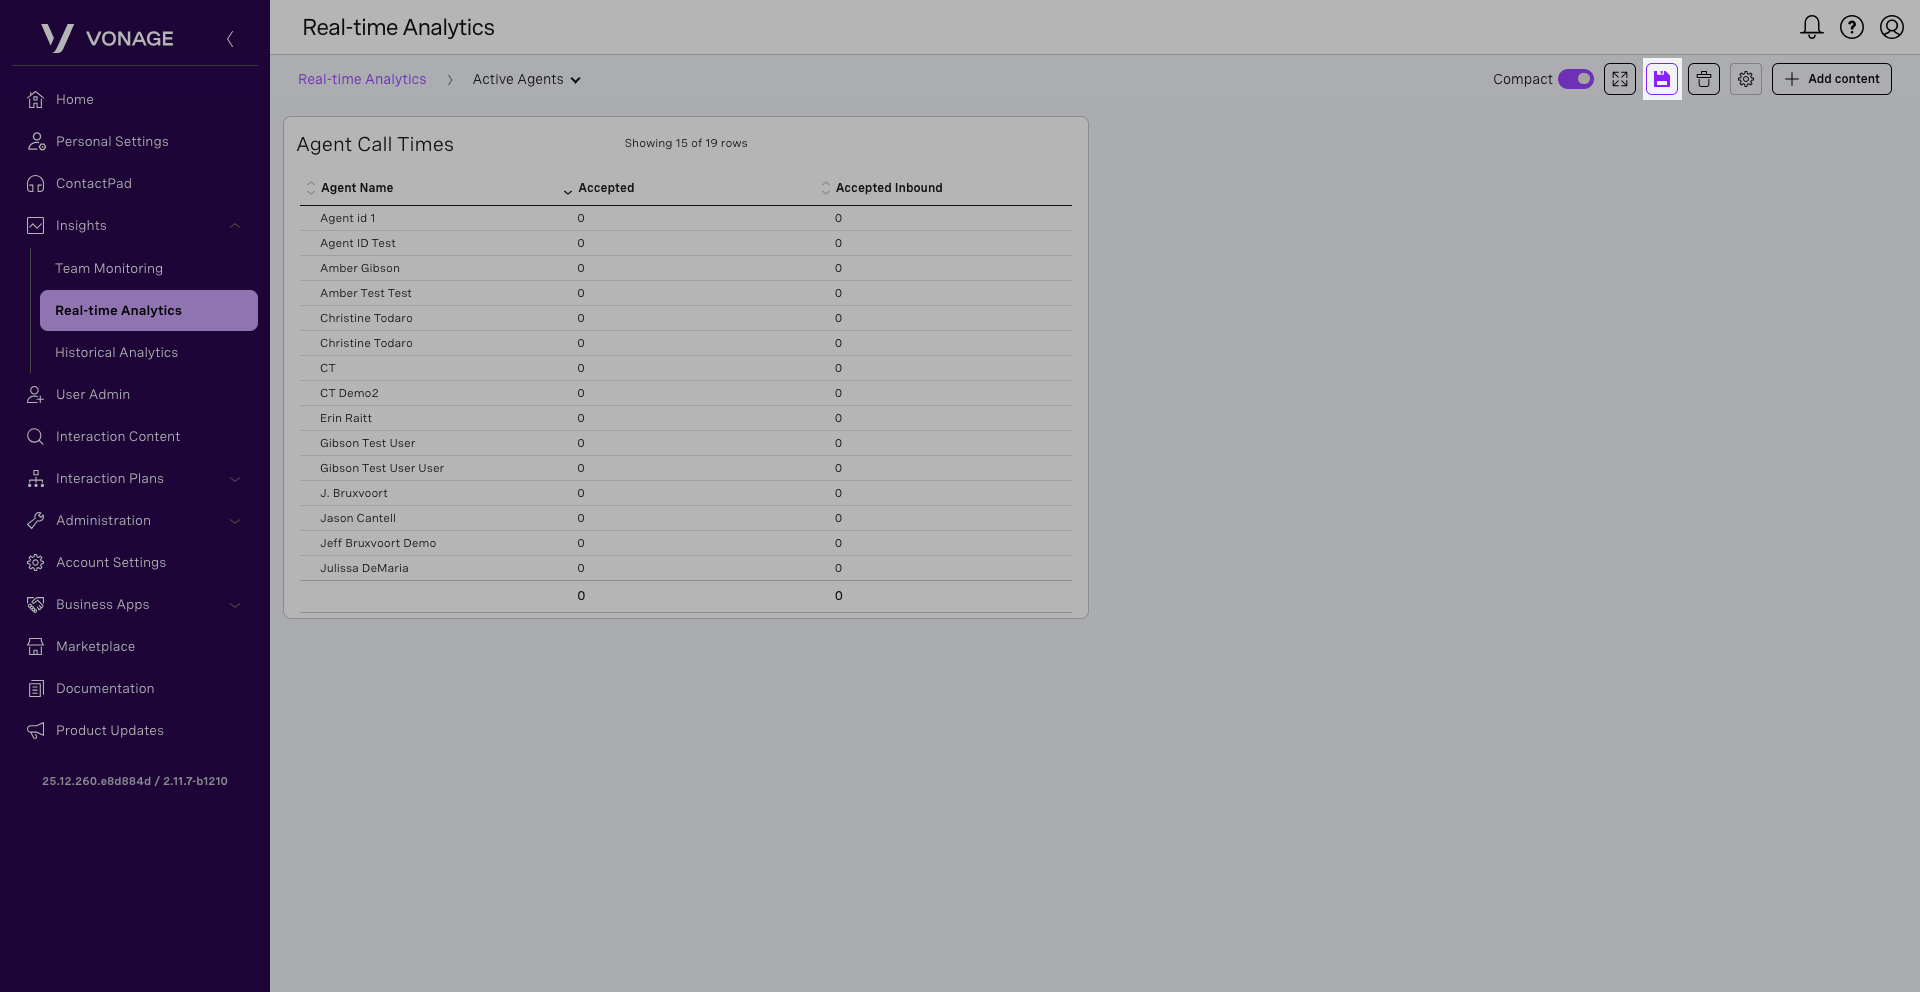
Your widget will appear within your dashboard. Click the Save icon.
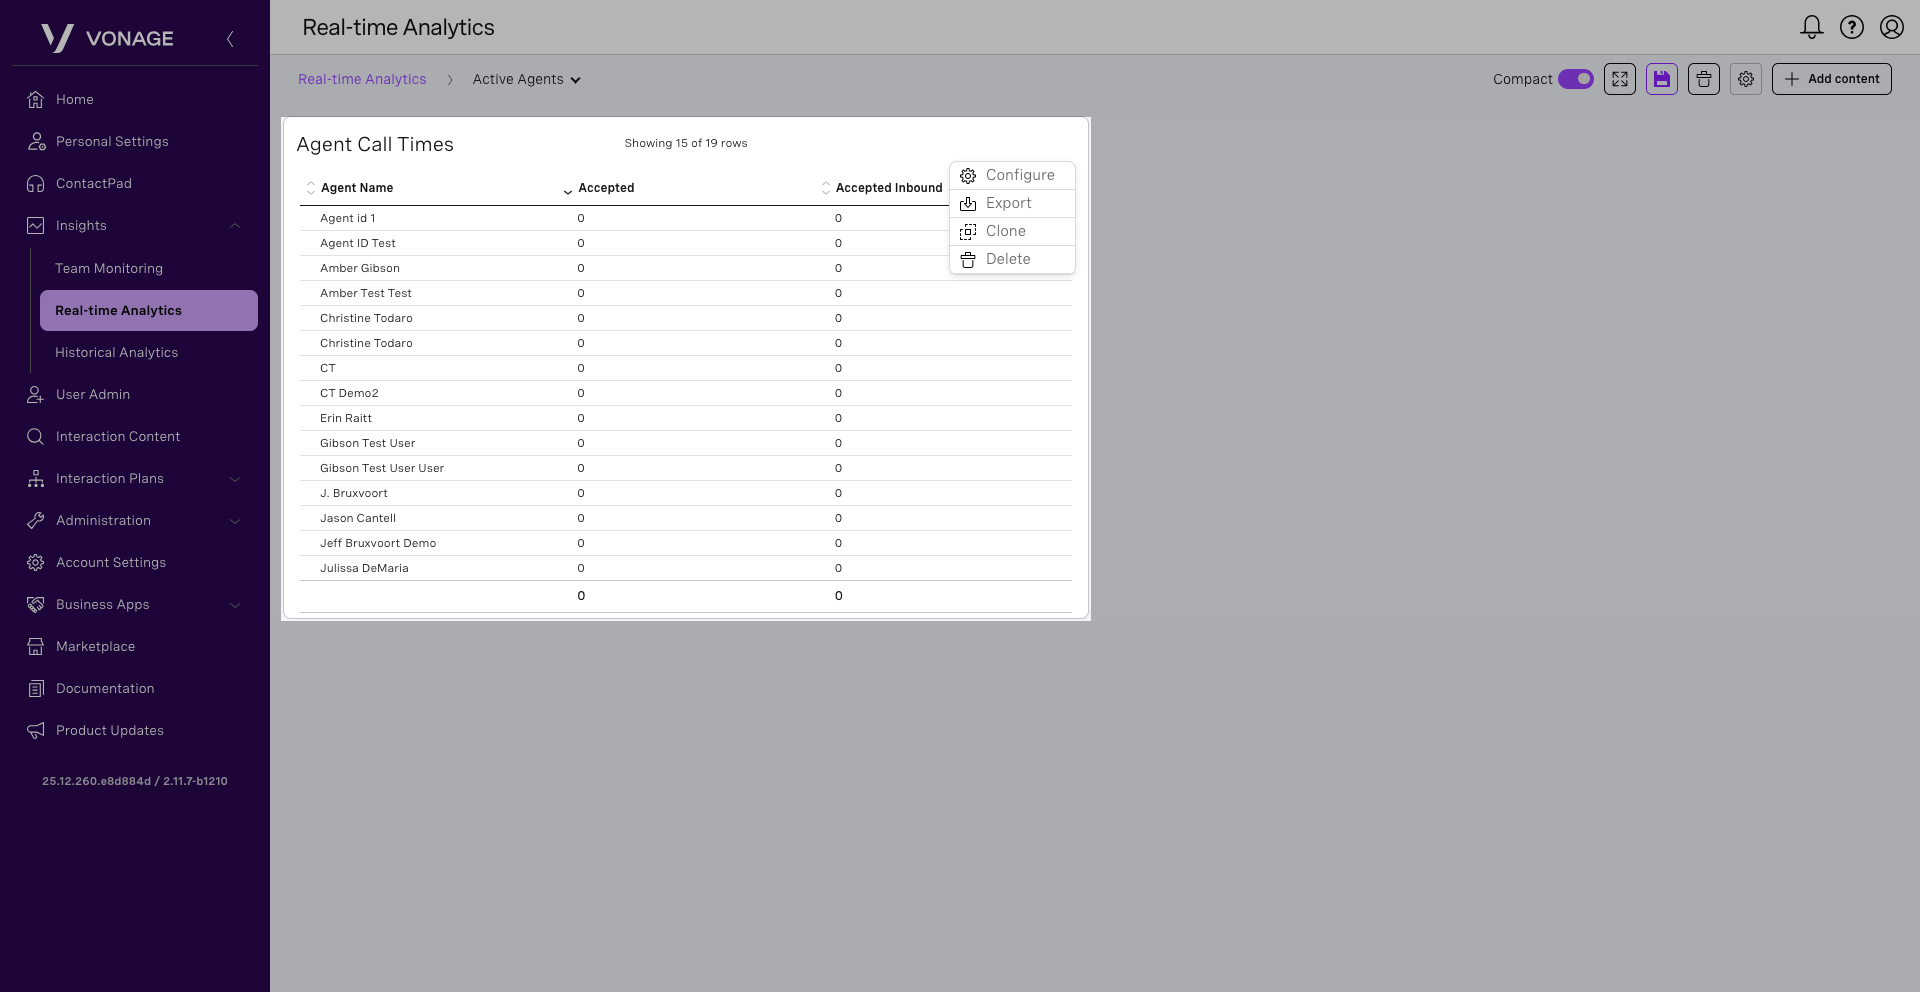
Edit a widget
To edit an existing widget, locate it within the dashboard, hover over it, and click the More icon and select Configure.